
Page 146 - Demo
P. 146
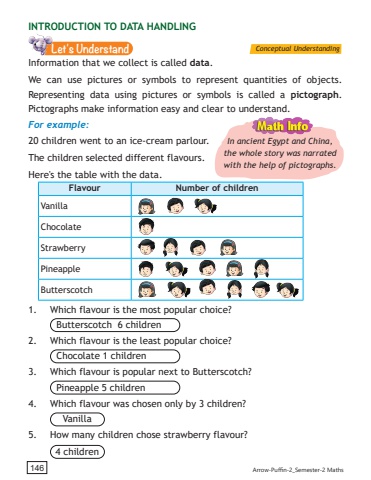
146 Arrow-Puffin-2_Semester-2 MathsInformation that we collect is called data.We can use pictures or symbols to represent quantities of objects. Representing data using pictures or symbols is called a pictograph. Pictographs make information easy and clear to understand.For example:20 children went to an ice-cream parlour.The children selected different flavours.Here's the table with the data.1. Which flavour is the most popular choice?Butterscotch 6 children2. Which flavour is the least popular choice?Chocolate 1 children3. Which flavour is popular next to Butterscotch?Pineapple 5 children4. Which flavour was chosen only by 3 children?Vanilla5. How many children chose strawberry flavour?4 childrenINTRODUCTION TO DATA HANDLINGIn ancient Egypt and China, the whole story was narrated with the help of pictographs.Flavour Number of childrenVanilla ChocolateStrawberry Pineapple Butterscotch Let's Understand Conceptual Understanding
